Standard Deviation
Averages do not tell us everything about a sample. Samples can be very uniform with the data all bunched around the mean (Figure 1) or they can be spread out a long way from the mean (Figure 2). The statistic that measures this spread is called the standard deviation. The wider the spread of scores, the larger the standard deviation.
Averages do not tell us everything about a sample. Samples can be very uniform with the data all bunched around the mean (Figure 1) or they can be spread out a long way from the mean (Figure 2). The statistic that measures this spread is called the standard deviation. The wider the spread of scores, the larger the standard deviation.
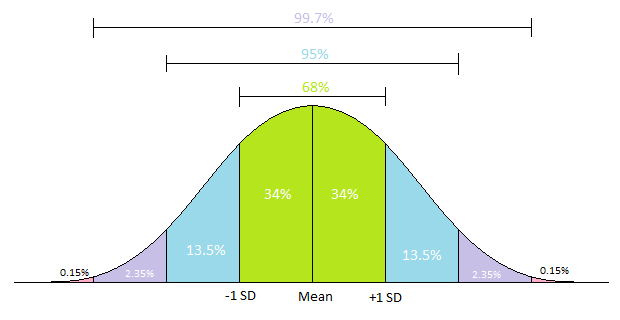
For data that has a normal distribution, 68% of the data lies within one standard deviation of the mean.
How to Calculate the Standard Deviation:
Calculating the Standard Deviation in Google Sheets
- Calculate the mean (x̅) of a set of data
- Subtract the mean from each point of data to determine (x-x̅). You'll do this for each data point, so you'll have multiple (x-x̅).
- Square each of the resulting numbers to determine (x-x̅)^2. As in step 2, you'll do this for each data point, so you'll have multiple (x-x̅)^2.
- Add the values from the previous step together to get ∑(x-x̅)^2. Now you should be working with a single value.
- Calculate (n-1) by subtracting 1 from your sample size. Your sample size is the total number of data points you collected.
- Divide the answer from step 4 by the answer from step 5
- Calculate the square root of your previous answer to determine the standard deviation.
- Be sure your standard deviation has the same number of units as your raw data, so you may need to round your answer.
- The standard deviation should have the same unit as the raw data you collected. For example, SD = +/- 0.5 cm.
Calculating the Standard Deviation in Google Sheets
- In our class, the formula we'll want to use is =STDEV(A1:A100). Replace A1:A100 with your data by highlighting the cells with data you want to include in the standard deviation calculation.
- Calculating the Standard Deviation in Google Sheets (website)
- Finding the Standard Deviation in Google Sheets (video)
- Changing the number of digits displayed in your Google Sheet (website)
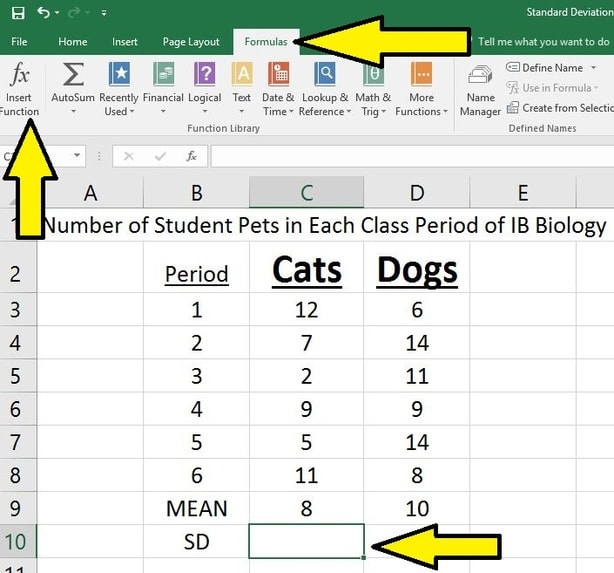
- Use Excel to calculate the mean of your data.
- Click on the box in which you want the Standard Deviation to be placed
- Click the "Formulas" tab at the top of the screen
- Select the “Insert Function button”
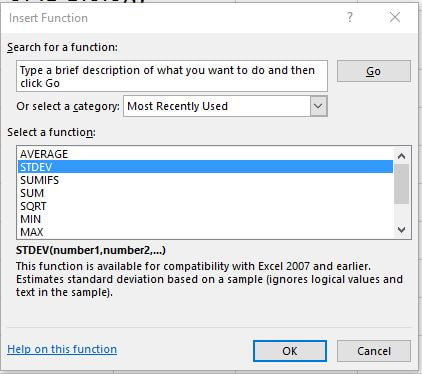
- Search to find the STDEV option, click OK
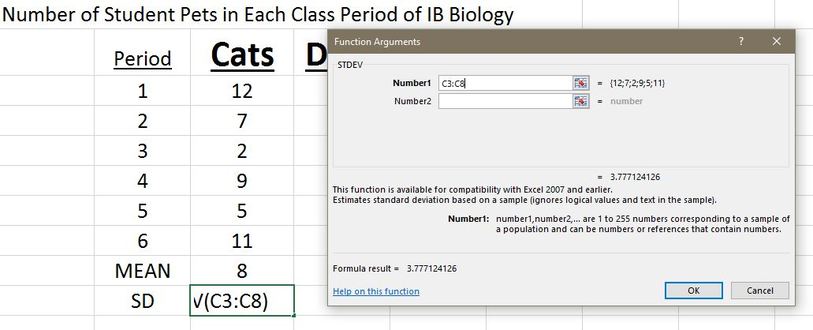
- Highlight the data of which you want the SD to be calculated, click OK. Be sure not to select the mean as one of your data points for calculating standard deviation. This is a common mistake.
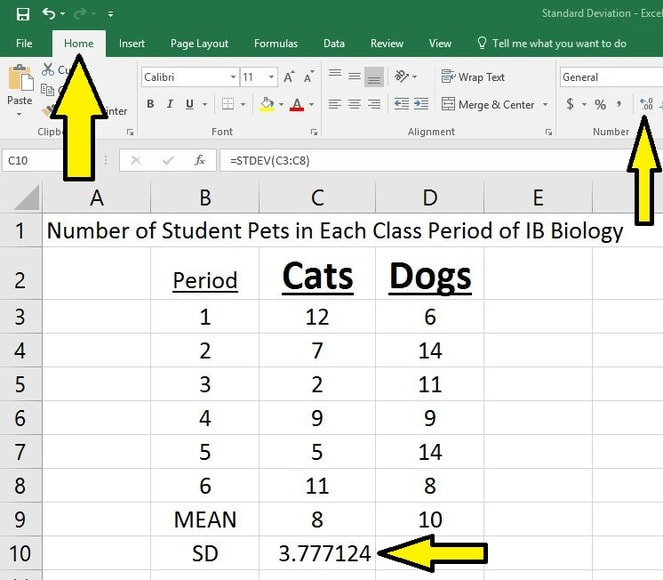
- Once you have the mean and standard deviation, you need to make sure that you set the values to the correct number of digits. EXCEL will default to giving you too many numbers after the decimal place. Your mean and standard deviation must have the same precision (number of digits after the decimal) as your data points. So, the example, the standard deviation should be a whole number. To do this, click the box which is displaying the standard deviation and on the "Home" tab click the decrease decimal button until you have the correct number of digits showing.
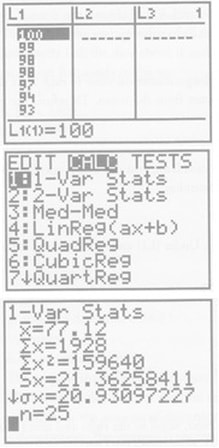
Using TI-83/84 to calculate the mean and the standard deviation
- First you have to enter the data. Hit the STAT button and you will see the options EDIT, CALC and TESTS atop the screen. Use the left and right arrows (if necessary) to move the cursor to EDIT, then select 1: Edit...
- Now you will see a table with the headings L1 and L2. Enter the values under L1 (if you want to clear pre-existing data first, move the cursor to the top of the column, hit CLEAR and then ENTER.)
- Once all the data is entered, go back to the STAT menu, but this time move the cursor to CALC instead of EDIT.
- Once you're in the CALC menu, select 1-Var Stats, then hit ENTER. The calculator will display the x-mean, some other stuff, and then the standard deviation (sx). Note that Sx is what we want.
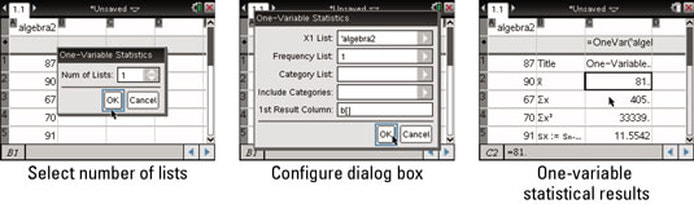
Using TI-INSPIRE to Calculate the Mean and the Standard Deviation
- Create a new list and type your data into columns. You MUST Name your list (arrow to the top of the column and enter the name of your list). Keep the name descriptive, but short.
- Once your data is entered, hit MENU, #4 Statistics, #1 Stat Calculations, and choose #1 One-Variable Statistics.
- Select "Open Variable Statistics." The calculator will display the x-mean, some other stuff, and then the standard deviation (sx). Note that Sx is what we want.